In my last blog, I talked about how the Picis Multi-Doc Viewer allowed the consolidation of disparate pieces of data from various sources to be consolidated into a centralized location for clinicians to view. Envision leveraging Microsoft Power BI, is another offering from Picis that allows hospitals to plug directly into their health management information system(s) and the Picis applications to view actionable data in user-friendly and custom configured reports.
Most health management information system reporting tools I’ve used have focused on department performances, episodic costing, and efficiencies reviews for patient movement within and throughout departments, looking for bottlenecks and ways to alleviate them. After several years of discussions related to “big data” analytics, literature is starting to reflect the use of captured data to provide actionable information to data consumers at the bedside (researchers, physicians, nursing staff, administrators, etc.). Large amounts of electronic data now exist for the consumer to sort through; they only need to know what question(s) to ask.
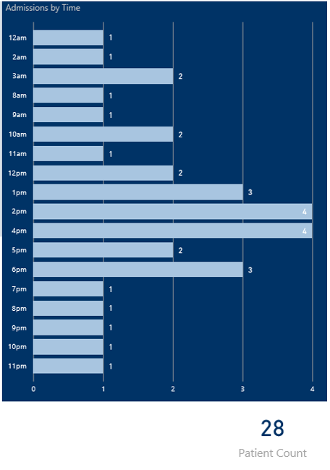
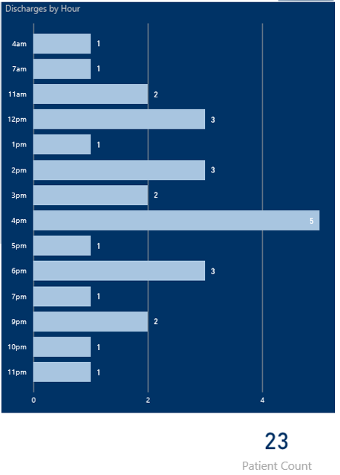
A review of the following screenshots for daily admissions and discharges can be used by staffing coordinators to determine when to increase/decrease staff throughout the day, ensuring utilization of staff at the appropriate times. Expand this information to look at weekly, monthly and yearly admit/discharge trends and units, so you can use previous trends to staff appropriately. This type of data analysis has historically been done using spreadsheets and simple analytic software systems, and continues to provide value:


Big Data
According to the NEJM Catalyst (January 1, 2018), big data in healthcare is “the abundant health data amassed from numerous sources including electronic health records (EHRs), medical imaging genomic sequencing, payor records, pharmaceutical research, wearables, and medical devices, to name a few.” The article goes on to talk about data lakes and data oceans teaming with information. This information from large-scale data sets can be used to focus care from a macro-level approach to a micro-level approach:
- Macro: Display re-admission rates for male and female patients post Coronary Artery Bypass Graft (CABG) over the age of 70 across an entire hospital network
- Micro: Display re-admission rates for CABG patients based on the following:
- Male vs. female
- Between the ages of 65-70, 70-75, >75
- With history of: diabetes, BMI>30 and previous / current smoker
- Post Anesthesia Care Unit (PACU ) Pain level >3 upon admission AND discharge from PACU
- Post Op Nausea and Vomiting (PONV) results positive upon arrival to PACU
- With prophylactic antiemetic dosing intraop (drug specific)
- Without prophylactic antiemetic dosing intraop
- For patients in the following areas:
- State/city/facility
As educated consumers continue to demand value (in cost, outcomes and efficiencies) for their healthcare expenditures, healthcare providers, insurers and organizations are leveraging the data that has been stored across several systems to improve patient care and outcomes at a more localized level than had previously been possible. But the problem still exists, especially among smaller facilities:
- How do facilities justify expenditures to create and modify reports?
- Who determines what data points are of value?
- How to display the data in a user-friendly consumable format?
A common theme over the past few years among clinicians I’ve worked with has been trying to determine what data to look at and how to decipher that data. Presented with options, it quickly becomes data analysis paralysis, i.e., “We don’t know what we don’t know, nor do we know where to begin.” By taking into consideration the data accumulated through patient care documentation (demographics, diagnosis, comorbidities, medications, labs, vital signs, care provided, etc.) across several independent systems, the wealth of information can be staggering to sort through. By starting small, looking for real-world problems, we can quickly identify real-world solutions.
Real-World Application
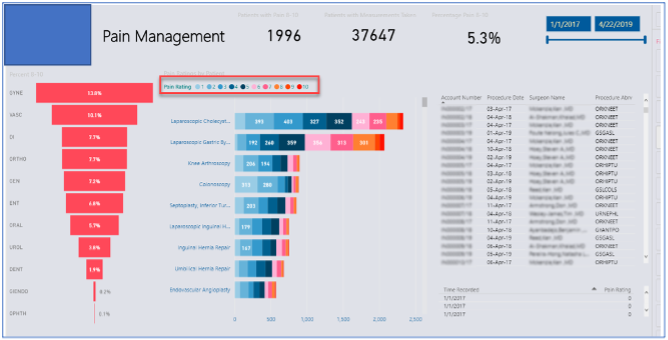
Recently two separate Picis clients asked about obtaining data related to pain control postoperatively and PONV. They hypothesized that if they could minimize both issues, their post-operative recovery times would improve—allowing earlier discharges, less risks of post-op complications, improved patient compliance and increased patient satisfaction scores. All these actions in turn would relate to better health outcomes for the patient and improved financial benefits for their respective facilities. Step one was to determine what the exact goal of the information was, then break down specific ways to display the data. In the example below, pain management was broken down by: Department>>Procedure>>Pain Level>>Surgeon.
- Further breakdown will include type of pain medication administered, doses, time intervals between dosing, additional treatments/therapies, etc. to then determine best treatment options for future cases
- Looking at the type of pain medication used, efficacy and cost will also be reviewed to determine if the desired outcomes are being met and whether a lower cost medication may meet the same outcomes

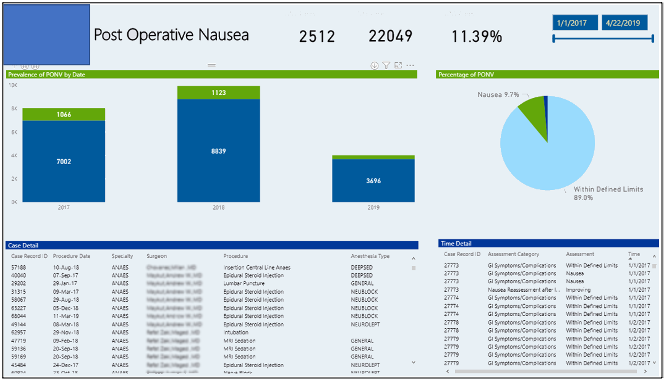
In the following screenshot, similar concepts were considered and applied when determining what data to capture and how to display it:

PONV data was captured using annual data sets. Drill-down capabilities will allow the clinician/researcher to determine efficacy of treatments based on procedure types, intervention timeframes, alternative efforts to alleviate PONV, patient disposition and any extended length of stays that may have been caused by the PONV symptoms. This will then be used to make evidence-based decisions to impact patient care.
The benefit of Microsoft’s Power BI and Picis Envision is that the clinician is not restricted to just a single database at a time for queries. Clients now can run queries against several databases simultaneously. This now allows the “data lake” to be queried more efficiently, pulling in data from several sources allowing clinicians to view pertinent data in one report, rather than attempting to amass data sets across several systems and several reports.
Improved patient care and outcomes, more patient specific treatment modalities, cost reductions, and evidence-based research localized to the patient are now within reach of most clinical staff. Now it’s just a matter of asking the right questions and building the right queries to get the necessary data. The ability to sift through vast amounts of data and validate outcomes through EHRs is now easier than ever. You just have to ask the right questions and ensure the documentation exists.
About the Author
Rob Aldrich, Team Lead, Professional Services
 Robert has been a Registered Nurse for over 25 years. His experiences in patient care range from rural hospitals in Alberta, to heart/lung transplant patients in Texas, to Transplant/Trauma services at Johns Hopkins Hospital in Baltimore. Travel nursing allowed him to build a wealth of knowledge across several different documentation systems and to work with various clinical champions across the country. Transitioning to software informatics allowed Rob to provide training and product improvements to clinicians that were increasingly spending more time documenting, and less time caring for their patient. His goal is to ensure the products in the clinicians’ hands will improve their experiences with the patient, rather than impede their patient care while providing data that can be used to individualize patient care.
In his spare time, he sells real estate in the Arizona Market, coaches his son’s hockey team and enjoys camping and traveling with his wife and two children whenever time allows.


